

NEW YORK: Global oil prices had been dancing on the edge of a bearish technical signal, only to swerve away and open the door to a more bullish one instead.
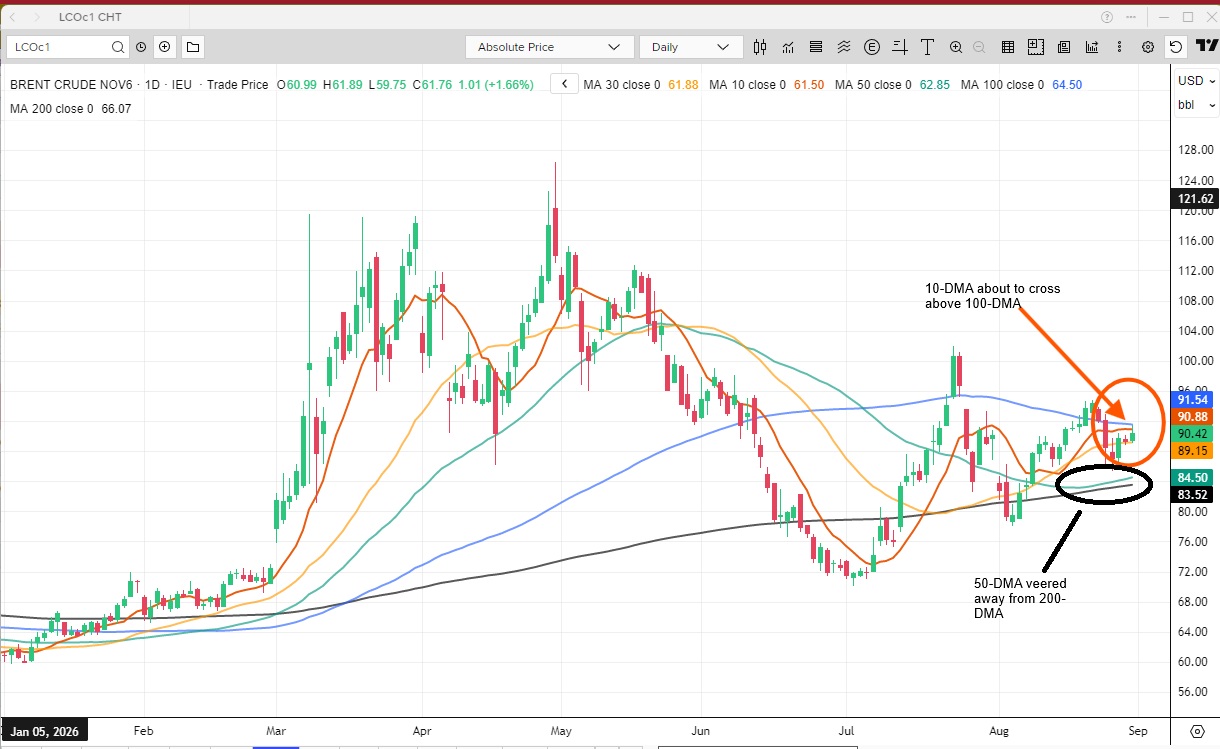
Brent crude, the international oil benchmark, has been driven by headlines from the Iran conflict since hostilities began at the end of February and prices were sliding earlier this month on hopes the Strait of Hormuz might reopen. That decline, layered on top of the broader retreat from April's peak, contributed to the decline in the 50-day moving average since late May, bringing it close to crossing below the 200-day average -- a pattern technical analysts call a "death cross," typically viewed as a sign that sellers are gaining the upper hand.
That cross never quite happened. Prices swung higher again on fresh doubts about easing Iran tensions, and now the market is flirting with the opposite signal: the 10-day moving average has been positioning to potentially rise above the 100-day average, forming a "golden cross," often seen as a hint of further gains - though the momentum behind that move is already fading.
Both signals are considered lagging indicators because they take place after big moves have been factored into the moving averages, but they can still spark fresh buying or selling once triggered. A rise above this month's high of US$94.83 per barrel could revive bullish momentum toward July's peak of $102. A fall below last week's low of US$85.41, however, could open the way toward US$78.11 and eventually July's low of US$70.14.
What the chart shows:
- 50-day/200-day "death cross" narrowly avoided as prices rebounded
- 10-day/100-day "golden cross" close, though losing momentum
- Key levels: resistance at US$94.83 and US$102; support at US$85.41, US$78.11, US$70.14